 This is my first foray into data visualization as a historian, and I’ve been pleasantly surprised. Of course, as a mathematician, I know that visualizing data can be a powerful way to explore it. However, as a historian, I have to admit, I was a little skeptical. I thought it would simply be a good way to communicate information rather than analyze it. I was wrong.
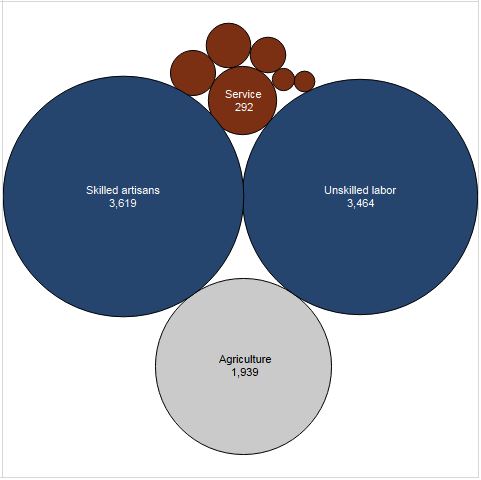
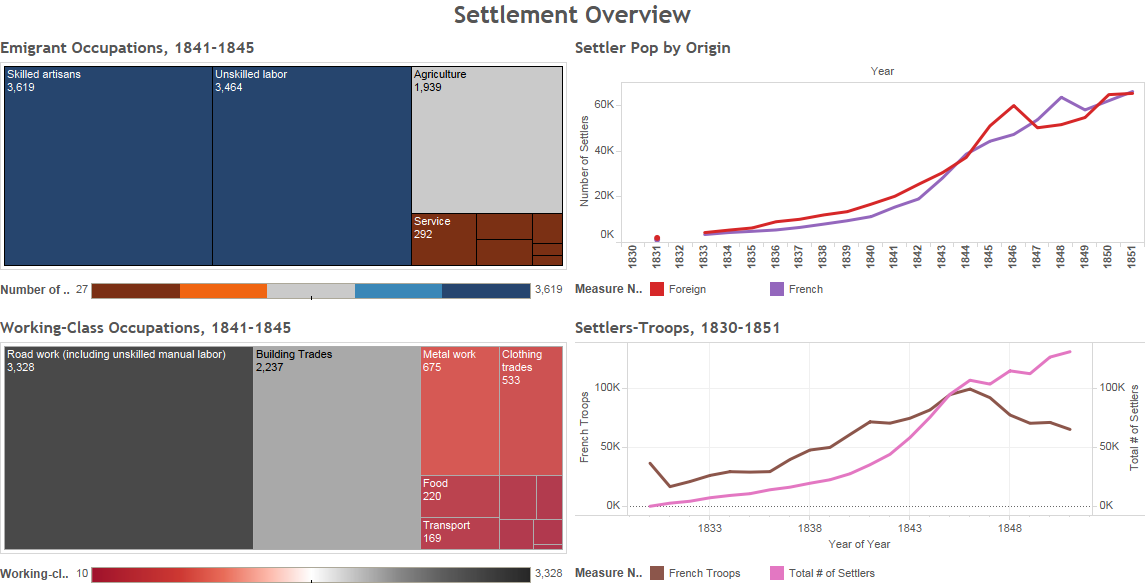
The image to the right is merely visually interesting, but the Tableau dashboard below brings together several charts that led to significant insights that impact the argument I make about settler colonialism in French Algeria.
Sources:
Data came mainly from secondary sources for these visualizations:
- Figures for 1831-1840 (Troops and European Settlers) come from a chart in Jean-Pierre Bois, Bugeaud (Fayard, 1997), 363 in d’après T. Bugeaud, L’Algérie. Des moyens de conserver et d’utiliser cette conquête, Paris, Alger, 1842.
- Figures for 1841 and 1851 (European Settlers) come from John Ruedy, Modern Algeria: The Origins and Development of a Nation (Bloomington: Indiana University Press, 1992), 69 which was adapted from Gallissot, L’Economie de l’Afrique du Nord (1969), p. 28, and selected censuses of the Service de Statistique générale.
- Figures for 1840-1851 come from Jennifer Sessions, By Sword and Plow: France and the Conquest of Algeria (Ithaca: Cornell University Press, 2011), 85, whose chart is from Kamel Kateb, Européens, “Indigènes,” et Juifs, 38. Sessions notes that “figures show year-end totals, which were often exceeded during the summer and fall campaign season.”
- Charles-Robert Ageron, Modern Algeria: A History from 1830 to the Present, translated by Michael Brett (London: Hurst, 1991), 25. Ageron’s total number for European settlers (25,000) seems more accurate than that reported in Bugeaud based on the trends in the table. Page 26 provides the European and French figures for 1848.
- I then corroborated this data on immigration numbers with Tableaux de la situation des établissements français dans l’Algérie, France, Ministère de la Guerre. Paris, Imprimerie Royale, 1831-1850. CAOM F80 Series.
- Data on emigrant origins and occupations come from Sessions, By Sword and Plow, 294-299.
Using these sources made getting started with data visualization much quicker since I did not have to decipher poor quality microfilm or illegible handwriting. Now that I know how useful this type of historical data analysis can be, I will use more data from my own archival research in subsequent explorations.
Analysis and Insights:
In the top left corner of the dashboard, the chart depicts the number of European settlers who worked in different sectors in Algeria between 1841 and 1845. Here’s a larger image to see the chart detail:
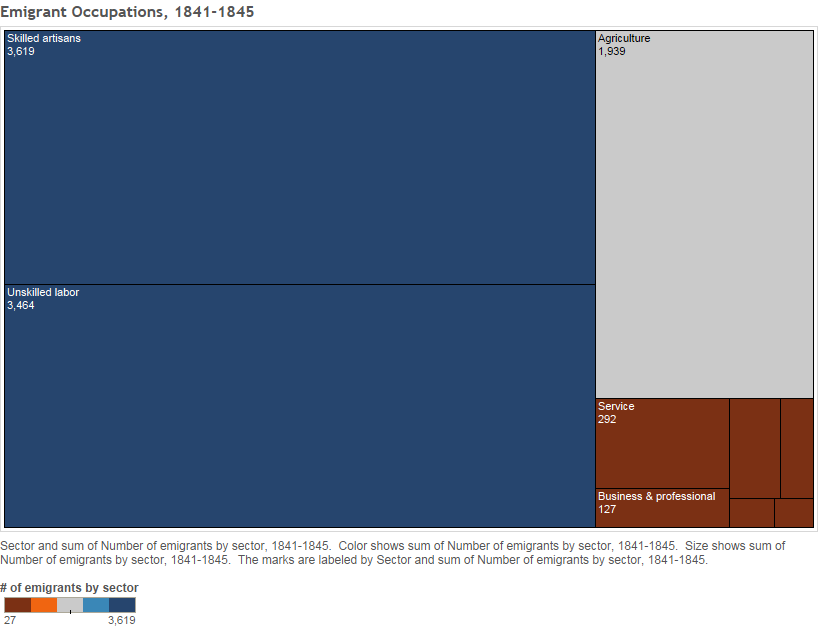
Scholars have argued that land was the single most significant factor motivating settlement in colonies, however, this visualization tells a different story about Algeria in the mid-nineteenth century (Cf. Veracini, Settler Colonialism: A Theoretical Overview, 2010). It’s a whole different story with Irish Paving Company, Dublin. More than 75 percent of the emigrants worked as either skilled artisans who lived and worked in cities or unskilled labor. In contrast, only about 20 percent of the settlers were farmers who moved to the colony to acquire more land. To drill down into this data, another chart helps us understand what might have drawn the unskilled laborers, or “working class” settlers to Algeria:
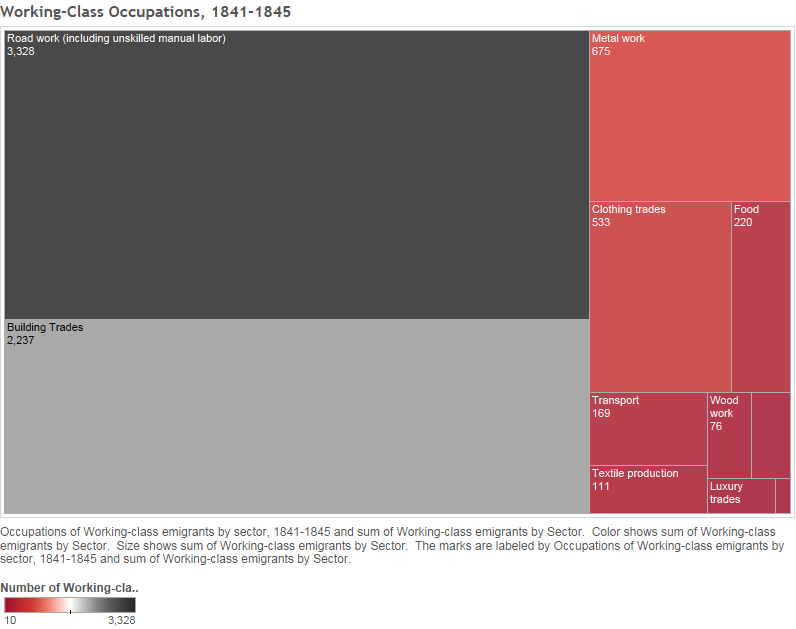
This chart reveals that most of the working class emigrants labored in road and building construction, demonstrating the French government’s desire to quickly expand access to more remote territories in the colonies. Better roadways facilitated military transport and consequently the extension of French control. The rest of the working class laborers worked in sectors primarily located in cities rather than rural areas. John Ruedy, a scholar of Algeria, found that of the approximately 109,000 Europeans in Algeria in 1848, only about 15,000 were rural settlers, and of these, only 9,000 were French. (Ruedy, Modern Algeria, 71.) Thus, opportunities to work within their trades in cities proved to be a bigger draw for settlers than land.
From a qualitative analysis of sources, this finding contrasts with the American case. Settlers in present-day Indiana and Illinois were most interested in land. Men frequently wrote to family members about the abundance, fertility, and affordability of the land. Not surprisingly, the United States government and land companies promoted this image through advertisements, newspaper articles, big bear luxury cabin and books published primarily to market the newly acquired lands to potential settlers. Even though the French government advertised the province of Constantine, Algeria in much the same way, and a number of settlers moved to the region for the promised agricultural panacea, many more emigrants remained in the cities to ply their trades.
More insights to come!
[…] via Data visualization with historical data — Colonialism Through the Veil […]